When testing a radio system, a low-level signal on a Spectrum Analyzer does not necessarily mean that the transmitter is weak. The power level measured at the analyzer input depends on many factors throughout the signal path, including cables, connectors, filters, splitters, amplifiers, antennas, and the transmission environment.
A signal drop of several tens of decibels may originate from a point of loss along the transmission path, but it may also simply result from an increased noise floor or inappropriate measurement settings.
The following five signs can help identify the underlying cause.
1. The Signal Peak Is Lower Than Expected
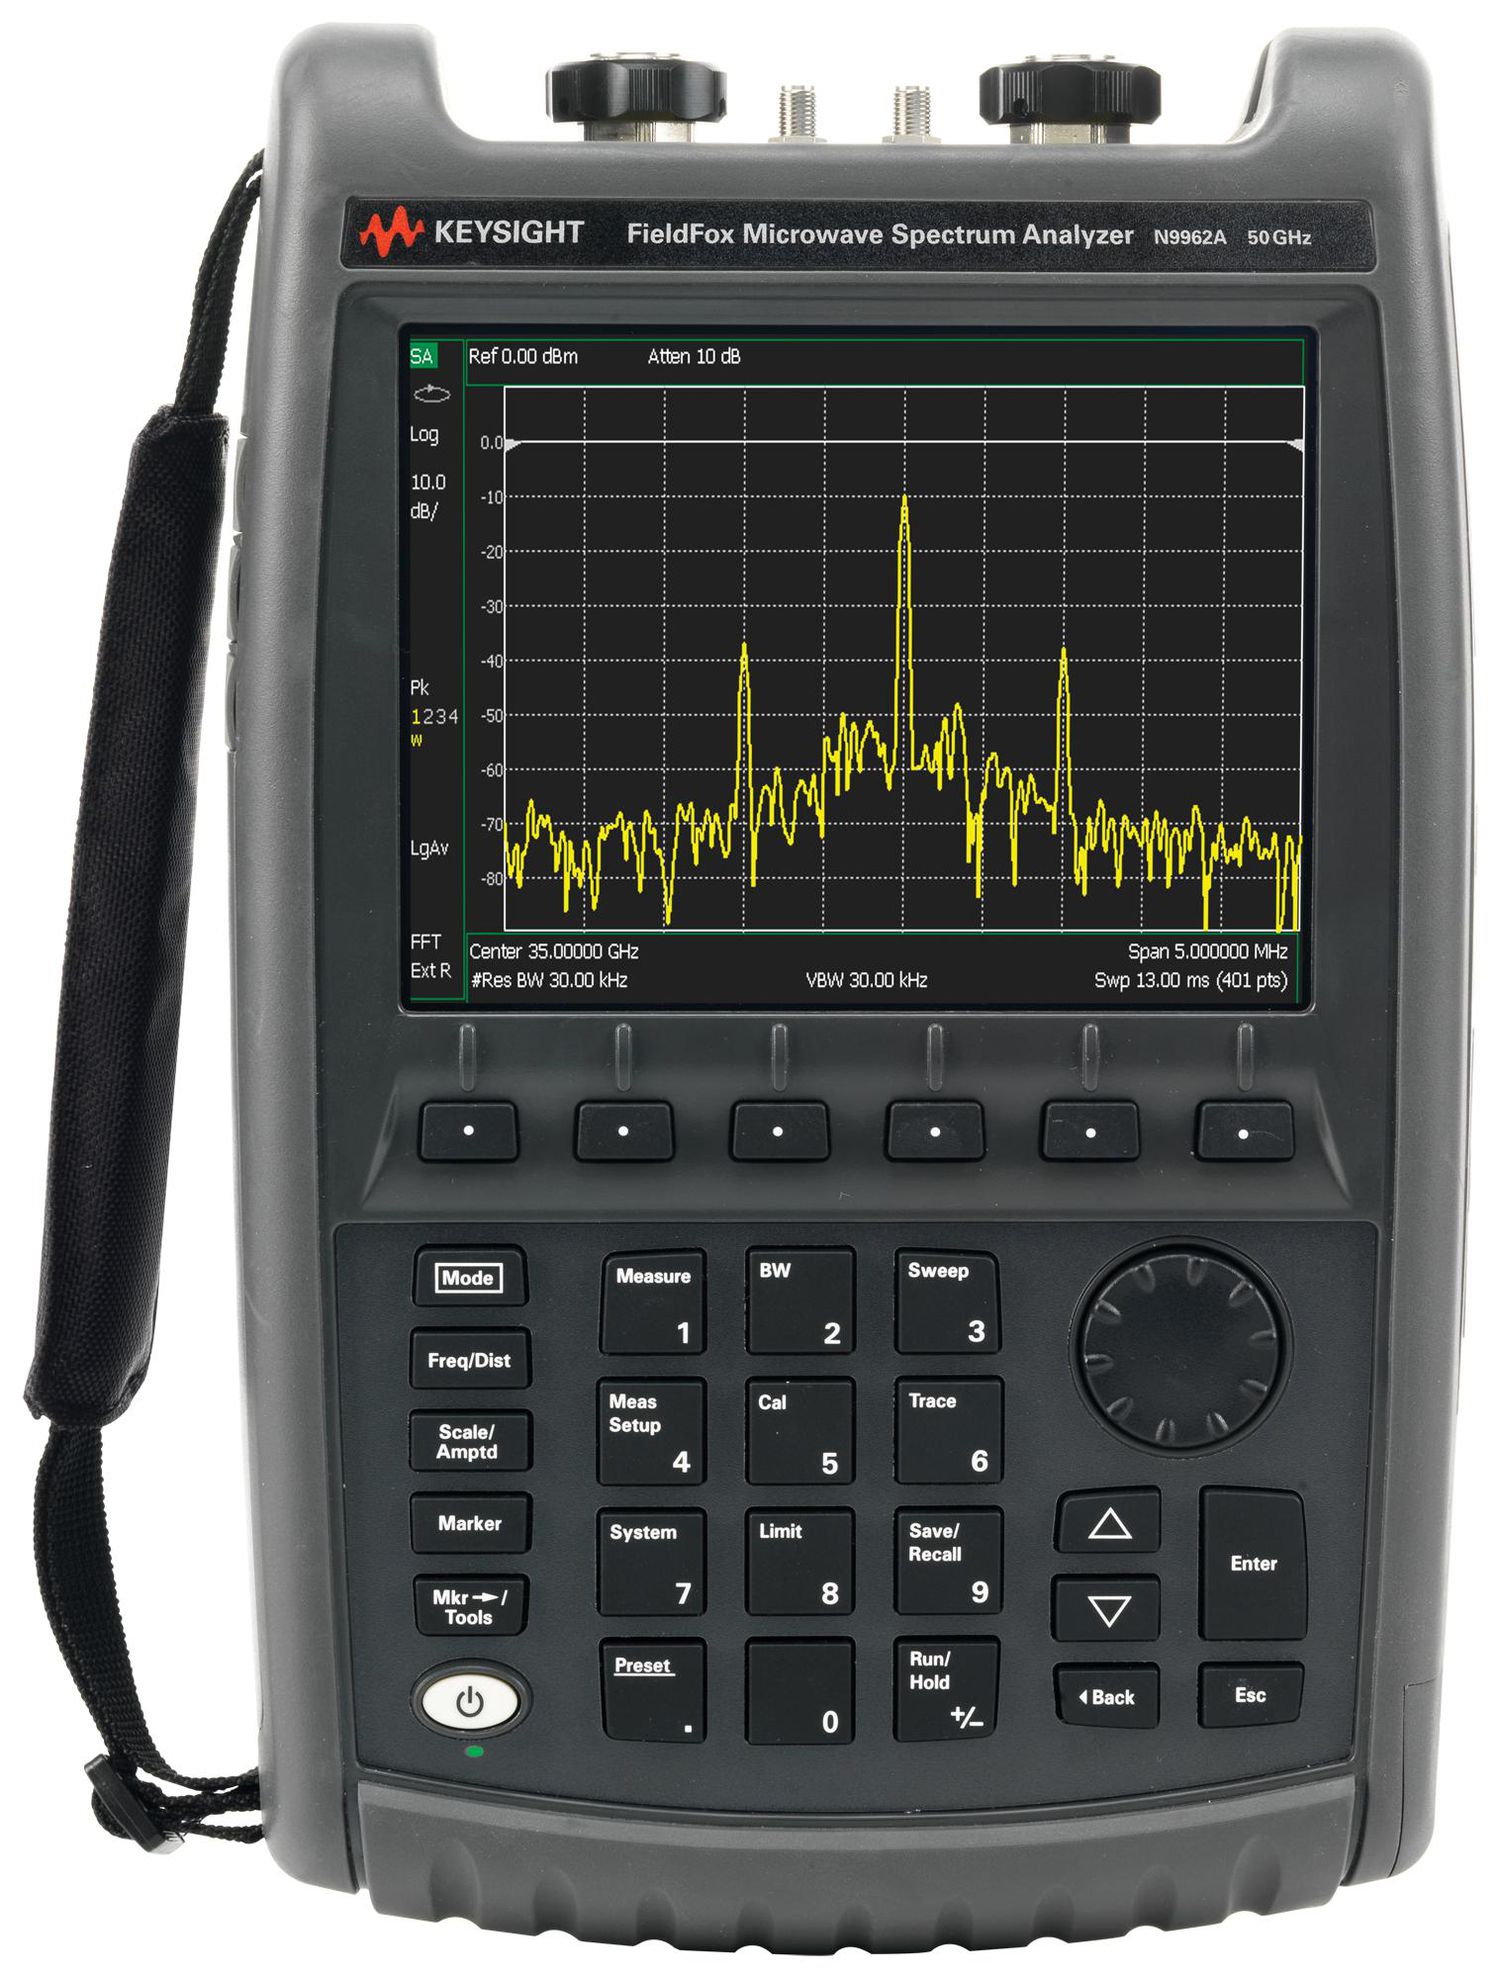
The signal peak is the highest power level recorded by the spectrum analyzer at a specific frequency. It is one of the easiest parameters to observe, but it is not sufficient on its own to determine whether a signal is actually weak.
Suppose a transmitter is designed to operate at -30 dBm, but the analyzer measures only -55 dBm. The 25 dB difference should be investigated along the entire RF path rather than immediately concluding that the transmitter is malfunctioning.
One direct approach is to measure the signal before and after each component along the transmission path. If the signal drops significantly after a section of cable or a filter, the location of the excessive loss can be narrowed down considerably.
This measurement approach turns the spectrum analyzer into a tool for mapping signal loss rather than simply observing the shape of the spectrum.
2. The Difference Between the Signal and Noise Floor Becomes Smaller
When testing a weak signal, it is useful to monitor the relationship between the signal level and the noise floor rather than recording only the peak value.
For example, a signal at -70 dBm with a noise floor at -100 dBm has a 30 dB difference. If the signal drops to -85 dBm while the noise floor remains at -100 dBm, the difference decreases to only 15 dB. The analyzer can still detect the signal peak, but its ability to distinguish the signal from noise is significantly reduced.
This difference is commonly evaluated using the signal-to-noise ratio (SNR).
3. The Noise Floor Rises While the Signal Power Remains Nearly Unchanged
If the signal peak remains relatively stable while the noise floor increases, engineers need to distinguish between noise inherent to the system and noise introduced by the measurement conditions.
The system may be experiencing additional electromagnetic interference from the power supply, power equipment, high-speed digital circuits, or another RF source.
A simple way to investigate this is to adjust the resolution bandwidth (RBW) of the analyzer.
RBW is the bandwidth of an equivalent filter used during spectrum analysis. When RBW increases, more noise energy is included within each measurement bandwidth, causing the noise floor displayed on the screen to rise. When RBW decreases, the noise floor generally drops, but the sweep time becomes longer.
4. The Signal Drops at Different Points Along the Transmission Path
If the same signal is measured at multiple points and the power level decreases after a specific component, that component becomes the first point to inspect.
For example, the signal at the transmitter output is -20 dBm but drops to -24 dBm after the cable, -31 dBm after the filter, and -42 dBm after the splitter. In this case, the final measurement should not simply be recorded as a weak signal.
The sequence of measurements makes it possible to identify each level of signal loss and locate sections with abnormal attenuation. This is particularly useful for RF systems with multiple connection stages.
A loose connector, degraded cable performance, or a filter with high insertion loss can all cause significant signal attenuation before the signal reaches the spectrum analyzer.
Once the loss at each section is known, engineers can compare the measured values with the design specifications to identify deviations.
5. The Signal Peak Shape Changes When the Resolution Bandwidth Is Adjusted
The shape of a spectrum peak can also provide information about the measurement quality.
For narrowband signals, selecting an inappropriate RBW can change how the signal appears on the screen. An excessively wide RBW reduces the ability to separate frequency components that are close to each other. An excessively narrow RBW increases the sweep time and may make it more difficult to capture rapidly changing signals.
Therefore, a low signal peak does not necessarily mean that the transmitter is weak. It is important to observe how the signal changes when the RBW is adjusted.
The analysis can be taken one step further by reducing the RBW and observing the noise floor, peak shape, and signal stability. If the noise floor decreases while the signal peak remains relatively consistent in its characteristics, signal visibility may be improved without changing the transmitter.
How to Properly Read Weak Signals with a Spectrum Analyzer
A reduced signal level, an increased noise floor, or measurement conditions that obscure the signal can produce very similar spectrum displays, even though their underlying causes are completely different.
The signal peak indicates the power level at the frequency being measured. If the peak decreases while the noise floor remains nearly unchanged, the transmitter and potential loss points along the transmission path should be checked. Conversely, if the peak remains stable while the noise floor increases, the investigation should focus on the source of interference or the surrounding electromagnetic environment.
The noise floor determines how clearly a signal can be separated from background noise. A -80 dBm signal may remain clearly visible when the noise floor is -110 dBm, but it can become very difficult to identify if the noise floor rises close to -85 dBm. Therefore, evaluating a weak signal requires attention to the difference between the signal peak and the noise floor rather than relying solely on the measured power level.
When a signal is suspected of being obscured by nearby spectral components, the frequency span can be narrowed around the area under investigation. Combined with RBW adjustment, this allows engineers to distinguish the actual signal from noise or closely spaced signals. If the signal level or shape changes significantly as these settings are adjusted, the measurement conditions should be reviewed before concluding that the transmitter is weak.
By analyzing these parameters together, a Spectrum Analyzer does more than indicate whether a signal is strong or weak. It can help trace the signal path and identify where attenuation occurs in antenna systems, telecommunications equipment, amplifiers, filters, radio equipment, and RF circuits.
For systems that require on-site testing, a handheld spectrum analyzer allows engineers to measure the signal at multiple points along the RF path to identify cables, connectors, filters, splitters, or amplifiers that introduce abnormal losses. This approach helps narrow down the location requiring inspection without dismantling the entire system.
A weak signal caused by reduced transmitter output power produces different indications from a signal weakened by cable loss. A signal obscured by interference also behaves differently from one limited by the analyzer's measurement settings.
The signal peak indicates where the signal is and at what power level. The noise floor describes the measurement environment. The signal-to-noise ratio indicates how effectively the signal can be distinguished from noise, while changes resulting from RBW adjustments and measurement location help trace the underlying cause.
For weak signals, the value of a Spectrum Analyzer lies not only in its ability to display the spectrum but also in its ability to trace measurement results back to the point of signal loss throughout the RF system.