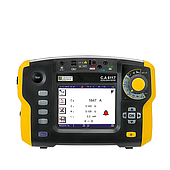
An abnormal peak appearing on a Spectrum Analyzer screen does not immediately reveal where the interference source is located. The peak may originate from a power supply, high-speed digital circuit, switching power supply, radio equipment, or a nearby radiating source.
What Does an Abnormal Peak on a Spectrum Analyzer Indicate?
On a frequency spectrum, a peak rising above the noise floor indicates that energy is concentrated within a specific frequency range. If the peak remains stable at the same frequency, there may be a relatively fixed emission source. If the peak changes over time or appears only when the equipment switches to a particular operating mode, sources of interference associated with that operating condition should be investigated.
The shape of the peak also provides useful clues. A very narrow and stable peak has different characteristics from interference spread across a wide frequency range. A series of evenly spaced peaks may indicate harmonic components generated by an oscillating or switching source.
To accurately locate the interference source, engineers need to monitor how the interference peak changes with frequency, amplitude, load, measurement location, and analyzer settings. Each change provides a clue that can help trace the path of the interference back to its source.
Determine Whether the Interference Peak Is a Real Signal
Before searching for the source, it is necessary to rule out the possibility that the peak is caused by inappropriate measurement settings.
The frequency span can be narrowed around the suspected area, while the resolution bandwidth (RBW) can be adjusted. When RBW changes, the noise floor and signal shape displayed on the screen may also change. Observing how the peak responds can help distinguish a real signal from an interference component or a measurement limitation.
If the peak continues to appear at the same frequency after multiple sweeps with appropriate settings, it is more likely to be a real component of the spectrum.
The noise floor should also be monitored at the same time. A -70 dBm peak on a -100 dBm noise floor is much easier to identify than a -60 dBm peak when the noise floor has risen to -55 dBm. Therefore, the peak level alone does not fully indicate the ability to detect a signal.

Monitor the Interference Peak When the Load and Operating Conditions Change
An effective way to trace an interference source is to introduce controlled changes and observe how the spectrum responds.
The equipment can be switched from standby to operating mode, the load can be changed, or individual functional blocks can be turned on one by one. If a peak increases clearly as the load increases and decreases when the load is reduced, the interference source may be associated with a power circuit or switching process.
For example, a switching power supply can generate interference components at its switching frequency and its multiples. If the spacing between peaks changes with the operating condition, the spectrum data can be compared with the circuit's operating frequency to narrow down the potential source.
This approach is often more effective than dismantling and inspecting each piece of equipment individually. The relationship between interference and operating conditions can provide direct clues about the emission source.
Measure at Multiple Locations to Trace the Interference Source
Once the suspected frequency has been identified, the measurement location should be changed to determine the direction in which the interference is traveling.
This approach is particularly useful for antenna systems, telecommunications equipment, amplifiers, and electronic systems with multiple connection paths. A signal cable that was not designed to carry RF energy can still become an unintended transmission path or radiating element.
For example, suppose a peak at 150 MHz appears at the system input. When measurements are taken at different points along the signal path, if the interference level gradually increases as the measurement point moves closer to a power supply or control circuit, the potential interference area has been significantly narrowed down.
For conducted interference, measurements can be taken before and after cables, filters, splitters, or connectors. If the interference level drops significantly after a particular component, that component may be introducing substantial attenuation. Conversely, if the interference level increases when moving toward a specific circuit branch, that branch should be investigated.
For radiated interference, a handheld spectrum analyzer can support direct on-site measurements. Moving the measurement antenna around the equipment while monitoring the peak level can help identify areas with higher interference intensity.
Examine Harmonics and the Noise Floor to Narrow Down the Cause
A single peak is often not enough information to identify the source. If additional peaks appear at related multiples of the same frequency, this pattern may be associated with the operating or switching frequency of the equipment.
For example, if a component appears around 20 MHz and additional peaks are found near 40 MHz, 60 MHz, and 80 MHz, circuits operating at or related to 20 MHz should be investigated. These peaks may be harmonic components generated by a non-sinusoidal waveform.
At the same time, the noise floor should be monitored. If the peak remains unchanged while the noise floor increases, another interference source may have appeared and is affecting the entire frequency range. If both the peak and noise floor increase, changes in the load or a new emission source in the measurement environment should be investigated.
By combining frequency, amplitude, harmonic structure, noise floor, and measurement location, engineers can more effectively distinguish between interference originating from a power source, conducted interference traveling through cables, and radiated interference propagating through space.
From an Interference Peak to the Source of the Problem
An abnormal peak on a Handheld Spectrum Analyzer is only the starting point of the troubleshooting process. The value of the measurement lies in the ability to monitor how the peak changes when operating conditions and measurement locations are modified.
For complex RF systems and high-frequency circuits, understanding how the spectrum changes can provide more diagnostic information than simply identifying the frequency of the interference peak.
If the peak increases with the load, attention should be focused on power and switching circuits. If the interference level increases as the measurement point moves closer to a particular component, the emission or conduction path can be traced in that direction. If a series of harmonics appears, the fundamental frequency and the structure of the peaks can provide additional clues about the oscillating or switching source.