
Manual datasheet

12/27/2013 08:46:20
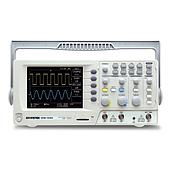
An oscilloscope plots a graph of an electrical signal. In most applications, the graph shows how the signal changes over time: The vertical (Y) axis represents voltage and the horizontal (X) axis represents time. The intensity or brightness of the display is sometimes called the Z-axis. This simple graph can tell us a lot about a signal.

09/05/2013 10:16:58
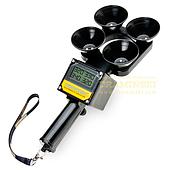
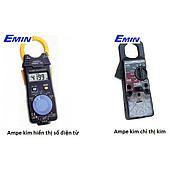
# Definition and Function of Clamp Meters In the context of increasing emphasis on automation and energy optimization, clamp meters have become an important
Stay Updated with Offers
Get exclusive volume discounts, bulk pricing updates, and new product alerts delivered directly to your inbox.
By subscribing, you agree to our Terms of Service and Privacy Policy.
Quick Support
Direct access to our certified experts