
01/04/2021 10:09:36
**Prodigit develops the latest 3310G Series electronic loads.** The 3310G is a highly upgraded version of the successful 3310G series electronic load family.
**Prodigit develops the latest 3310G Series electronic loads.** The 3310G is a highly upgraded version of the successful 3310G series electronic load family.

_EMIN Vietnam Joint Stock Company would like to inform customers, partners 2021 New Year holidays as follows_ Day off: From Friday, January 1, 2021 to Sun
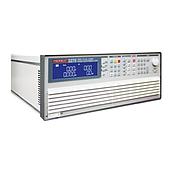
\- 4 digit V/A/W Meter, display the Voltage (Vrms, Vpeak, Vmax., Vmin), Current (Irms, Ipeak, Imax., Imin.), Watt, Voltampere (VA), Frequency, Crest
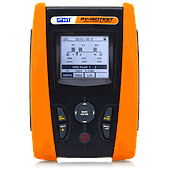
Lắp đặt hệ thống pin mặt trời trên mái nhà liệu có an toàn, hay sẽ tiềm ẩn nguy cơ hỏa hoạn? Hệ thống pin mặt trời có được nối đất đúng cách, hay sự cố lắp đặt sẽ khiến công đầu tư thành công cốc? Liệu người dùng có thể yên giấc mỗi đêm hay sẽ trằn trọc trong lo âu? Có lẽ hầu hết các chủ sở hữu hệ thống pin mặt đều có những mối quan ngại như vậy.
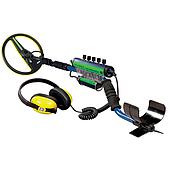
The guiding gadget for every quest
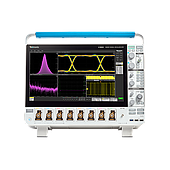
Troubleshoot and validate high-speed designs with bandwidth that starts at 1 GHz and goes up to 10 GHz . Get accurate measurements with low noise and sample rate up to 50 GS/s . See more of your design with 6- and 8-channel models...

Customers can choose one of the following options with the purchase of a new oscilloscope..
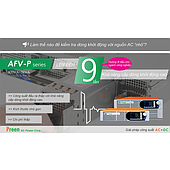
Series AFV-P of Preen has upto 9 times inrush capability

Emin Vietnam would like to announce the National Day 2/9 holiday schedule to our valued customers, Partners,

With the aim of serving customers with the best after-sales services, EMIN Vietnam has established the Equipment Inspection - Calibration - Repair Service Center
Get exclusive volume discounts, bulk pricing updates, and new product alerts delivered directly to your inbox.
By subscribing, you agree to our Terms of Service and Privacy Policy.
Direct access to our certified experts